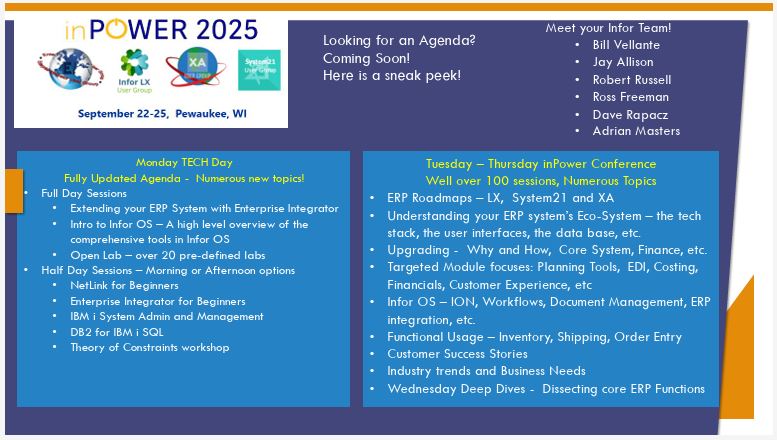
We’re thrilled to invite you to inPower 2025, taking place September 22 to 25, 2025! This annual conference is the premier event for the LX/BPCS community , bringing together users, experts, and partners to explore the latest advancements, share best practices, and connect with peers who understand your ERP challenges and goals. Get all… […]
Read More… from Join Us at inPOWER 2025 – Discover What’s Next for LX/BPCS
Your ERP system needs to be well-understood to be an effective business tool, and your first step is to look at how the backbone of your company’s operation is being utilized. Partner with Crossroads RMC for Success Thursday, May 15, 2025, from 1:00 pm to 1:30 pm (US/Eastern) Join Frank Petrasio and George Moroses to… […]
Read More… from WEBINAR: Partnering for Success – ERPLX Utilization Review
Miss inPower 2023? The below link offers you an opportunity to delve deeper into IDF through a presentation by our own Nick Olson, given at the conference. The presentation is titled “Top 10: Favorite IDF v10 Features.” You can download it here! 21556 Rate this article: 5.0 […]
Read More… from Explore IDF v10’s Top 10 Features with Nick Olson’s Presentation from inPower 2023 – Download Now
Join the LX User Group Board and Dave Rapacz, LX Product Manager, to learn more about the details of the first in-person event since 2019, inPower 2022. July 12, 2022 11:00pm CT | 12:00pm ET They will discuss what to expect at inPower 2022 and the value to the attendees. Register today via the community… […]
Read More… from Update from Infor Community: inPOWER 2022 – When is it, What is it, Where is it, and Why attend?
Infor is taking a new approach to managing many of its IBM i-based ERP systems and supporting the customers that rely on them to run their businesses. Called Compass, the new group is tasked with revitalizing Infor’s relationships with IBM i customers by catering to their unique needs, according to the company. Infor created the… […]
Read More… from Infor Moves IBM i Products to New ‘Compass’ Group
Registration is open for the face-to-face LN North America User Group Annual Meeting! Things are finally turning around and opening up! We’re looking forward to the day when the pandemic stays firmly in the rearview mirror. It’s definitely exciting to be buttoning up the details of the agenda for this event. This is our chance… […]
Read More… from Collaborate IN-PERSON With Infor LN Users
The package includes numerous reports and sessions to view the variances in a way that Finance can identify problems based on the Finance Integration Transactions in the General Ledger. There are a few main sessions with many detailed sessions linked to them. The reports can be run from the main Print Production Order Variance Reports… […]
Read More… from Crossroads RMC is proud to introduce our new Production Order Variance Reports package for Infor LN
Graphical representation makes complex concepts—like the intricacies of an ERP system—more universal, relatable and easy to understand. ERP dashboards gather and visualize critical metrics from across the organization, offering insight into the performance, outlook and interconnectivity of business processes. By setting up ERP dashboards that illustrate key metrics and compellingly communicate operational performance, key stakeholders… […]
Read More… from About 65% of the world’s population are visual learners. This extends into the ERP software realm, too.
Graphical representation makes complex concepts—like the intricacies of an ERP system—more universal, relatable and easy to understand. ERP dashboards gather and visualize critical metrics from across the organization, offering insight into the performance, outlook and interconnectivity of business processes. By setting up ERP dashboards that illustrate key metrics and compellingly communicate operational performance, key stakeholders… […]
Read More… from About 65% of the world’s population are visual learners. This extends into the ERP software realm, too.