Please Wait a Moment
X

Infor LX Tips, Infor LN Tips, BPCS Tips, Baan Tips, Infor M3 Tips & Infor ERP News

Crossroads Connections

Infor ERP Tips & News from the Experts

Infor LX | Infor LN | BPCS | Baan | Infor M3

DATA: See it. Understand it. Discuss it.

Customer Orders SummaryWe’ve all heard author and management consultant Peter Drucker’s famous quote “If you can’t measure it, you can’t manage it.”  

What’s the right way to manage “It” though? Is it enough to put the data in the hands of the responsible manager and wait for change to occur? Does the manager have a pulse on everything that went into those numbers?

Your numbers tell a story, but there is a lot of “how” and “why” that creates a backstory that affects the interpretation and the actions needed to improve. Does your manager have the backstory? Probably not, so you share the numbers and invite employees to participate in the discussion, only to discover that the 3rd shift was short-staffed for over a week, or a material shortage caused a delay in order fulfillment, or quality issues resulted in a large amount of rework, thereby delaying other production runs. How do you get ALL of this information without the need to discuss it with each person doing the work? 

D A S H B O A R D S !   See it. Understand it. Discuss it.
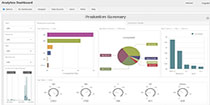
Production Summary Dashboard

Production
Summary

OEE, time usage, downtime, quantities, cycle times, and more...
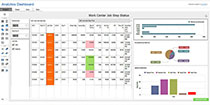
Job Step Status Dashboard

Work Center Job Step Status

OEE, time usage, downtime, quantities, cycle times, and more...
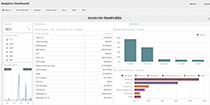
Accounts Receivable Dashboard

Accounts Receivable
Summary

Revenue, income, working capital, assets,
and more...
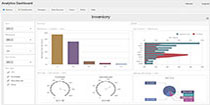
Inventory Dashboard

Inventory
Dashboard

Planning, sourcing, procuring, transporting, storing, and more...

Dashboards are key to transforming your data into meaningful action that boosts performance. They show key performance indicators so employees can discuss what's going well, and what needs to be improved. Display Dashboards on individual computers, or tablets, or broadcast on big monitors in common work areas so your teams can establish a cycle of continuous improvement.

Crossroads RMC’s Analytics Dashboard product provides a meaningful tool for team discussion and improvement.

Request a demo or get started with a FREE 30-DAY TRIAL today.
(Includes pre-built views for Infor LN, Infor LX, Baan, and BPCS) 

Request a Demo / Free 30-Day Trial > Infor LX or BPCS
Learn More > Infor LX & BPCS

Request a Demo / Free 30-Day Trial > Infor LN or Baan
Learn More > Infor LN & Baan

Previous Article Infor LX & BPCS Tip: Tracking Financial Journal Entries
Next Article Infor LN & Baan Tip: Why it's important to stay on a current porting set
Print
13161 Rate this article:
5.0
Crossroads RMC

Crossroads RMCCrossroads RMC

Other posts by Crossroads RMC

Theme picker

Contact author

Please solve captcha
x

Tips:  LX | BPCS | M3

  • Sit down with your IT team. Decide how the information will be captured and where it will be stored so that employees have access to it. What software tools need to be used to capture the information? How does it need to be organized? Create a repeatable process to make this easy for your staff.
     
  • Interview the person. Have them talk you through his/her job. What are the things they do every day? What are their biggest challenges? How do they overcome them? 
     
  • Have someone shadow the person for a week. Watch what they do and how they do it. Ask questions. Who does he/she interact with in their department? Outside of their department? Why?
     
  • Find out what tools he/she uses to perform their job? Are there spreadsheets?  Reports within your ERP / outside of your ERP? Separate stand-alone databases? Drawings? Websites? Why does he/she use them?
     
  • Video record how the person does their job. Is their technique critical to “doing it right” the first time and not ending up with a bunch of scrap that you can’t reuse?
     
  • Figure out if the person does anything special on a monthly, quarterly, or annual basis that might not come up during the observation period or interview. 
     
  • Map how he/she uses your business system and how that impacts the rest of the company. Understand both the “what” and the “why”. Without this, new employees may end up figuring out what they need to do, but never understand why they need to do it.

Optimize Your Manufacturing Today!

  • Are you tracking downtime? Is it done manually, or with some type of automation or application that gathers information in real-time, or is it based upon history?
  • If you are measuring team effectiveness by shift, you know there are significant differences between them. Have you figured out why?

One of our automotive customers was experiencing significant inefficiencies and difficulties with their receiving operations. After analyzing their operation, we discovered a disconnect between how they were tracking their incoming goods and what their ERP system thought was on hand.

This disconnect created time-consuming steps to process incoming material and determine where the material was needed. The manual process slowed production, caused additional staffing needs and hindered their ability to effectively get needed material to the assembly line. They chose to implement our data collection solution to automate the process.

Since implementing the solution, receiving and moving material was quicker, more accurate and efficient. This enabled the addition of another assembly line, increasing production volume – without adding staff.

Optimize Your Manufacturing Today!

First111112113114116118119120Last

Theme picker

Tips: LN | Baan

All actions required for converting, validating, matching, and posting electronically received bank statements can be performed within a single session:

  • Bank Statement Workbench (tfcmg5610m100)
  • Bank Statement (tfcmg5610m000)

Alternatively, you can use the sequence of electronic bank statement sessions outlined below.

Steps to Process Electronic Bank Statements:

12345678910Last

Theme picker

Categories